Guide points
- model description
- significant design decisions/extensions
- experiments methodology and results, comparison to other models
- tipping points
- equilibrium states
2 Baseline model
The first proposed model implements all basic behaviours present in subsequent models, with slight differences. This environment generates a set of fishes and dolphin around a 2D space where they’re free to move. The fish agents have a set of rules for:
- Roaming: the fish moves in a random direction.
- Fleeing: the fish flees in the direction opposite to the predator when it sees it. If multiple predator are near the fish, it flees in the direction opposite to the nearest predator.
- Reproducing: the fish can spawn another fish in an adjacent position after a fixed set of time. The dolphin agents have a set of rules for:
- Roaming: the dolphin moves in a random direction.
- Hunting: the dolphin chase in the direction of a fish when it sees it. If multiple fishes are in the range of vision of the dolphins, it chase the nearest.
- Eat: the dolphin eat the fish when it reaches its position, removing the target agent from the simulation. For a coding base, i used the [Wolf Sheep Predation meh](http://ccl.northwestern.edu/netlogo/models/community/Wolf Sheep Predation meh) by dj| model present in the NetLogo library.
2.1 Significant design decisions and extensions
Fishes and dolphins have their own separate parameters for speed and vision range, while another parameter exclusive to fishes is the reproduction rate, expressed in ticks. Fish reproduction can be turned off with the apposite switch. Vision is not limited to the agent’s facing direction: their vision consists of a full circle around the agent’s with radius as a parameter in the model. Dolphins are only allowed to eat fishes if and only if they’re in the same space as their prey. This is a result of the reference model i used, where wolves would eat sheep following the same condition. This led to giving the dolphins the ability to adjust their velocity to catch fishes if they’re close than their current velocity, as otherwise they might get stuck in a back and forth exchange where the dolphin never reaches the fish for any speed difference greater than 0.
2.2 Methodology and results
Research was conducted to find under what conditions and limits the network is in a state of equilibrium, while still being able to predict where the fishes or the dolphins would dominate the environment. That is, at what point do the survivability of fishes exceeds the dolphin hunting effectiveness, and thus we’ll see an increase in the population? at what point the population growth will be equal to the lost fishes? A proper state of equilibrium was not achieved during the tests because of the inconsistency of the dolphin’s time to eat a given amount of fishes. Instead, every parameter was tested in a neutral environment (no advantage to fishes nor dolphins) to see how the changes affected the given statistics. Interest was particularly given to the number of ticks in the simulation before the fishes got extincts. Common parameters: Vision range for Fishes and Dolphins: 3 cells Dolphin speed: 1.2 cells Fish speed: 1 cell Fish reproduction rate: 150 ticks Dolphin population: 10 turtles Fish population: 100 turtles
All the experiment results are present in the report, with the corresponding name as a csv file.
2.2.1 Population
First off, the number of fishes in the simulation was estimated to increase the lifespan of the simulation at a directly proportional exponential increase. The number of fishes affected the length of the simulation not as predicted, as the increase seemed linear. This is because dolphins can eat one fish at a time. It makes sense that eating more fishes would require more time, hence the proportional increase in fish population and ticks elapsed.
The number of dolphins would then, logically, not be linear, as a dolphin can eat more fishes, but a fish cannot be eaten more than once. Each dolphin is responsible to a percentage of fishes eaten, while each fish is responsible only for itself to be eaten. The expected outcome of the variance in number of ticks is expected to be of rational type. With the experiments the predictions got confirmed especially when reproduction was enabled. Each dolphin made a huge impact on ticks elapsed, as well as fishes eaten per tick, being as high as 0.699, but retaining a much higher mean compared to the experiment with reproduction off. The mean of fishes eaten skyrockets when there are fewer dolphins in a reproduction enabled environment, as the fishes have more chances to reproduce, making the total population of fishes existed greater than in other simulations with higher amounts of dolphins.
2.2.2 Speed
Speed was estimated to be a deciding factor in fishes overpopulation, especially when the fish speed exceeded the dolphin’s speed. This was not the case once again, as in reality the reported ticks were closer to a tipping point behaviour rather than any linear increase. The tipping point is obviously when the fish speed exceeds the dolphin speed, but it’s interesting to see that they don’t overpopulate despite the massive advantage they have over the dolphins, which is the case because of their fleeing behaviour: dolphins have the chance to eat the fishes when it’s being chased by another dolphin or when the fish stumbles really close by swimming randomly. We experience a rise in fish survivability when the difference is small, but then with higher amounts of speed, the ticks elapsed start to lower a bit as a result of the fish speed causing the fish to move closer to the dolphins before it sees the predator.
Dolphin speed hugely impacted their hunting efficiency, ranging closer to a exponential increase as seen by the numbers reported. The fishes eaten each tick ranged from approximately 0.1 to around 0.5 with the peak of growth being around 1.5 and 1.7 speed. These results seem to be interconnected with the vision range, as the “tipping point” seems to be when the dolphins move at more than 50% of the fishes vision range, which makes perfect sense at a micro level.
2.2.3 Vision ranges
Vision had much more impact than predicted. a high vision range on the fishes causes to consistently end up in overpopulation, as they avoid being found in the first place by dolphins. Interestingly, the tipping point doesn’t seem to be the equality of vision ranges, but rather a strict higher value than the dolphin vision range. This is likely due to the same value of range resulting in dolphins chasing fishes at the same tick the fishes would start to flee, and that gives the dolphins chances to catch the fishes as they normally would in other scenarios. This is the first parameter to allow the overpopulation of fishes consistently, which is expected given the preventive nature of the function, as opposed to the last resort tactic of fleeing, that only boosts survivability inconsistently in the environment (higher speeds decrease survivability back again).
2.2.4 Reproduction rate
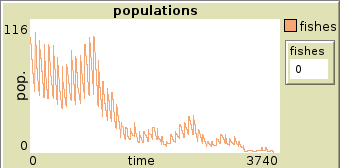
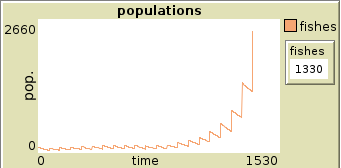
A strategy commonly seen naturally in our world, is to increase survivability trough numerous children and copulating often (eg. Rabbits). Unsurprisingly, when presented with an low reproduction cool-down, fishes were quickly to thrive in the environment. A tipping point in this scenario is around a reproduction rate of 68, which produces mixed results between dolphins eating everything and fishes thriving trough numbers. The fishes eaten statistic also shows us that in highly dense fish population environments food is way easier to stumble upon, as the chances of encountering a fish among many increases. Equilibrium states are difficult to achieve with a reproduction system such as this one we have implemented: fishes should reproduce around when half the population gets eaten, but being eaten does not happen on a flat rate. Instead, each reproduction interval, the amount of fishes eaten varies depending on the population of fishes left and random movements of the turtles. Achieving a true equilibrium where dolphins eat fishes and fishes never go extinct is rendered impossible as a slight inconsistency in an interval can snowball into fishes overpopulation or extinction.
Plot of population of fishes in two runs set with reproduction rate 68


3 Schooling of fish model
The second model studied implements the fish schooling behaviour. The chosen behaviour was based of the Boids behaviurs, but with some minor changes to ensure fleeing in our current model. In addition to all previous set of rules, we have additional rules for the fish agents:
- Separation: The fish moves away from other fishes if a given threshold distance between them is reached
- Cohesion: Move towards other fishes
- Alignment: Maintain alignment to other fishes
- Roaming: The fish no longer moves in a random direction. Instead, it will continue moving to its current direction. The dolphin agents have no changes in their rules.
3.1 Significant design decisions and extensions
Newly parameters include the fish collision range, a threshold for how far fishes should keep each other from in the schooling; a fish cohesion range, that defines how far a fish should look into to find the direction to move to other fishes, the cohesion and alignment weight, that determines the weight they have respectively on the fish movement, and the fishes max turn, that caps their maximum turning speed during each tick, only valid when not fleeing.
3.2 Methodology and results
Research was conducted to briefly compare the survivability of fishes compared to our previous model, and see if the expected schooling behaviour has an impact on the fish agents’ survivability. Then, different variation of the parameters have been tested to verify how each affects the outcomes of the simulation. Will the state of equilibrium and tipping point change compared to the previous models? What will the new parameters change in the simulation? Will there be substantial differences in the previous parameters’ importance with the new schooling behaviour? Common parameters: Vision range for Fishes and Dolphins: 3 cells Dolphin speed: 1.2 cells Fish speed: 1 cell Fish reproduction rate: 150 ticks Dolphin population: 10 turtles Fish population: 100 turtles Fish collision range: 1 Fish cohesion range: 3 Cohesion weight: 0.3 Alignment weight: 0.3 Max turn: 20
3.2.1 Previous parameters comparison
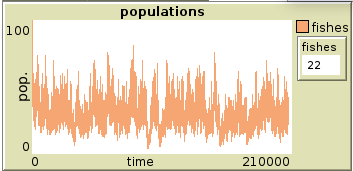
No difference was noticed in the population experiments’ results, the numbers kept their trends and behaviours across all 4 experiments. The speed of fishes without reproduction and the speed of dolphins in both cases didn’t report changes that affect the previous chapter’s observations, However, a state of equilibrium was reached within the experiments retaining the speed of fishes in a reproductive environment. When the speed of fishes exceeded the speed of dolphin in the fish speed with reproduction experiments, with 1.5 total speed, we saw a consistent state of equilibrium in all 5 runs, reported in the plot in figure 3. This is an interesting, consistent equilibrium state that maintains the fish population between roughly 70 and 5. This proves that contradictory to the expected schooling behaviour results, schooling decreases the effectiveness of survivability, as in the previous model experiment fishes consistently thrived into the environment with the same parameters.
 plot of equilibrium state on fish speed 1.5 vs dolphin speed 1.3
No changes to report that affect previous behaviours in the 4 experiments regarding vision ranges. The final reproductive experiment was analyzed also in terms of statistics with the other model, and we can definitely see that despite the simulation ending in the same tick as their counterpart when fishes overpopulate, the fishes eaten are in average higher in the second model. Schooling makes it easier for dolphins to hunt fishes, due to how by finding any given fish agent, the dolphin is able to pursue the entire schooling right after instead of having to hunt for another individual fish agent.
3.2.2 New parameters observations
The collision range of our fishes didn’t seem to affect the simulation at all, as the only tipping point worth mentioning is one we can easily expect: When the collision range is higher than the fish cohesion range, no schooling behaviour occurs, as the fishes never end up being close enough to each other to permit the trait to manifest in the environment. Cohesion ranges also didn’t affect much the simulation, going against the prediction that it would’ve worsened the survivability of fishes, as the agents would be even more concentrated into bigger schoolings, making hunting even easier for the dolphin agents. This wasn’t the case, as the hunting statistics didn’t get any significant change across runs. The weights that regulate the cohesion and alignment of fishes did also not impact the environment, there were no improvement or difference in the way hunting was performed, but the direction and movement of fishes in the schooling environment differentiated greatly: as cohesion approached high values the schooling effect became more chaotic until it didn’t ultimately resemble schooling behaviour; while alignment experienced similar but less chaotic results in fish movements, always experiencing a loss of the schooling behaviour. Maximum turn per tick was predicted to generate no difference in the experiments, and aside from the speed at which fishes form schooling, there isn’t much to report. In conclusions, none of the new parameters involved substantially changed the survivability of fishes in a noticeable way compared to the changes in the previous model, and the only interesting study we can perform over the schooling is the different sizes it can have depending on cohesion ranges. The worsening of the fishes survivability also led to a state of equilibrium in an environment where fishes would previously overpopulate the earth, which was an interesting discovery that will be discussed in later chapters.
4 Hunting strategy model
The third and final model studied implements a peer to peer communication system between our dolphin agents. This system aims to improve the hunting strategy of dolphins by communicating with each other the position of fishes in nearby dolphin’s vision range. The schooling of fishes behaviour is present in the experiments conducted. The dolphin policies have been expanded to include:
- Hunting: When any fishes are within vision range, chase the nearest fish and communicate the position of nearby fishes to close by dolphins.
- Follow instructions: if there are no fishes to chase, look for dolphins in communication range and find the closest fish to the current agent (myself), then move towards it as in hunting.
- Roaming: if there’s no fishes nearby and there were no fishes found trough communication, move in a random constant direction The fish agents had no changes in their policies compared to the previous model.
4.1 Significant design decisions and extensions
The only new parameter of this model is the dolphin communication range, which measures how far dolphins need to be at most from each other to be able to communicate.
4.2 Methodology and results
Research was conducted to compare the hunting effectiveness to the previous models, and study how and if the hunting strategy performs according to the aligned communication norm, how big the impact of the communication range is and if there are interesting differences in the found tipping points. Care was put to study when the hunting strategy had the most impact and under which circumstances. Common parameters: Vision range for Fishes and Dolphins: 3 cells Dolphin speed: 1.2 cells Fish speed: 1 cell Fish reproduction rate: 150 ticks Dolphin population: 10 turtles Fish population: 100 turtles Fish collision range: 1 Fish cohesion range: 3 Cohesion weight: 0.3 Alignment weight: 0.3 Max turn: 20 Dolphin communication range: 8 cells
4.2.1 Hunting effectiveness
The average length of simulations saw a decrease from the previous model, and the fish eaten per tick statistic got a bit higher across experiments, signaling that there was an improvement in the dolphin’s hunting strategy. The dolphin population table shows us that, as expected, the number of dolphins greatly increases the effectiveness of the strategy due to the higher amount of communicating nodes in the system, what was more unexpected was the level of impact of the dolphin population size, which made smaller sizes more consistent in hunting and bigger sizes substantially better at hunting, with lower ticks and more consistent fishes consumed each tick in average. Fish speed experiments confirm the more stable and consistent measures that the communication system now clearly causes. every measurement more closely fits each other run in the same category, largely because the ticks dolphin agents spent roaming are less common, and the time to eat each fish is more strictly the same.
4.2.2 Equilibrium
The state of equilibrium of the fish speed with reproduction model is completely changed due to the hunting strategy, and equilibrium is never reached because of the dolphins’ ability to communicate. The change is also quite noticeable too, as the biggest change we have introducing the hunting model is a reduction in ticks where dolphins are roaming, thus making them more consistent hunters. This effect was not completely expected but it falls in line with the results in the vision range experiments of the previous model, where prevention of danger exceeded the results of a better fleeing ability. An alternative equilibria in the model has not been found trough the experiments conducted, although with the amount of data and knowledge of the parameters’ effectiveness in changing the environment in favour of fishes and dolphins, it will be possible if not easier to find a state of equilibrium now that the eating times of dolphins are more consistent across runs.
4.3.3 Communication range
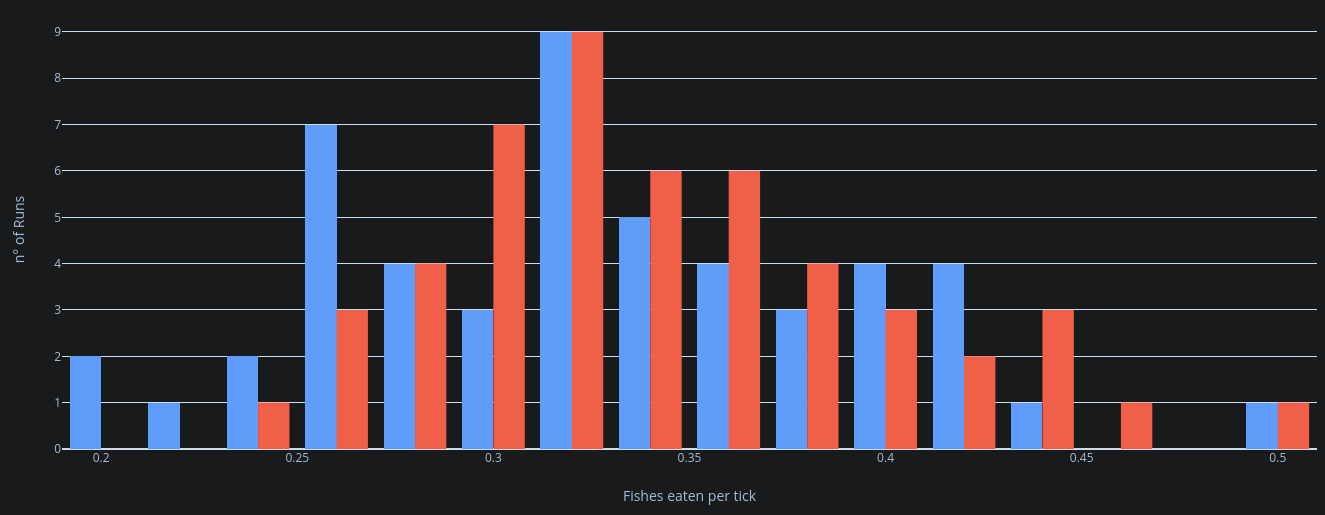
The results of the experiments regarding communication ranges (experiments of model 3 n° 13) were harder to understand, but it seems that the results follow a bell curve distribution that differs slightly from the previous model results regarding fishes eaten per tick. To be more precise, the distribution of fish eaten per tick became more consistent when communication was in the mix, with a bell curve that is more focused on the central side of the curve, while in the experiment where dolphins don’t communicate, the bell curve distributes its values on either ends, making them more spread out and varied.
 Figure X: distribution plot of 2 experiment runs: dolphin communication range 10 (blue) and dolphin 0 communication range (red)
As previously studied, this behaviour we see in the bell curve confirms once again the more consistent nature of the hunting behaviour, while it appears to not strictly improve the dolphins’ hunting capabilities.
Higher and lower ranges of communication was observed to not impact hunting in a noticeable manner.
5 Conclusions
Summing up all experiments results and case studies, we learnt how each parameter had an impact in the simulation, and we made interesting discoveries regarding the environment we created. Going in order of experiments, we experienced how the fish population linearly impacts the length of the simulation, and the tame interaction the size of the population has on other parameters. Dolphin population, on the other hand, had shown heavy impact on the simulation, decreasing drastically the survivability of fishes, communicating more efficiently in bigger numbers and exploiting their position in a natural way by catching fishes even when they’re faster than the predators. Vision ranges interestingly proved that a fish surivability increases dramatically when instead of trying to flee from danger, you avoid it entirely in the first place. It’s the first experiment where fish agents reached the maximum agent numbers allowed in the tests, and caused overpopulation consistency even in later models, avoiding completely the communication hunting strategy of dolphins by means of prevention. We studied how delicate the equilibrium state can be due to the inconsistency of the dolphins to eat fishes, and how close we can get to an equilibrium state in the schooling model, which we also discovered it does not help fish survivability. Communication among predators in the environment led to a more consistent series of result that didn’t seem too much affected by the range of their communication, a sign that despite the high churn experienced in the peer to peer model, dolphins can quickly adapt and replace nodes to find the next closest fish with no much impact on the overall simulation.
5.1 Suggested improvements
Schooling has proven to be a huge failure because of the results that went completely against the expectations, as it hindered fish survivability instead of helping it, so the first suggestion would be to rework the schooling such that it helps fish survivability, or maybe build a system that takes advantage of the schooling behaviour, for example a communication system equivalent to the one present in the third model to communicate nearby predators and alert other fishes to flee before they get in range of the dolphin would probably help with survivability since it ties into both prevention and fleeing behaviours. Another example would be to mimic what schooling does in nature, and make so predators get repelled by schoolings of fishes with a certain degree of effectiveness. Regarding instead the hunting model, some interesting additions that could be implemented would be a collision range like the fishes one to improve the effectiveness of the communication, as dolphins would keep apart from each other more frequently and thus have more potential range of communication due to the forced distance between them. In the same way, predators could also avoid chasing the same fish as a result of communicating it to nearby dolphins.